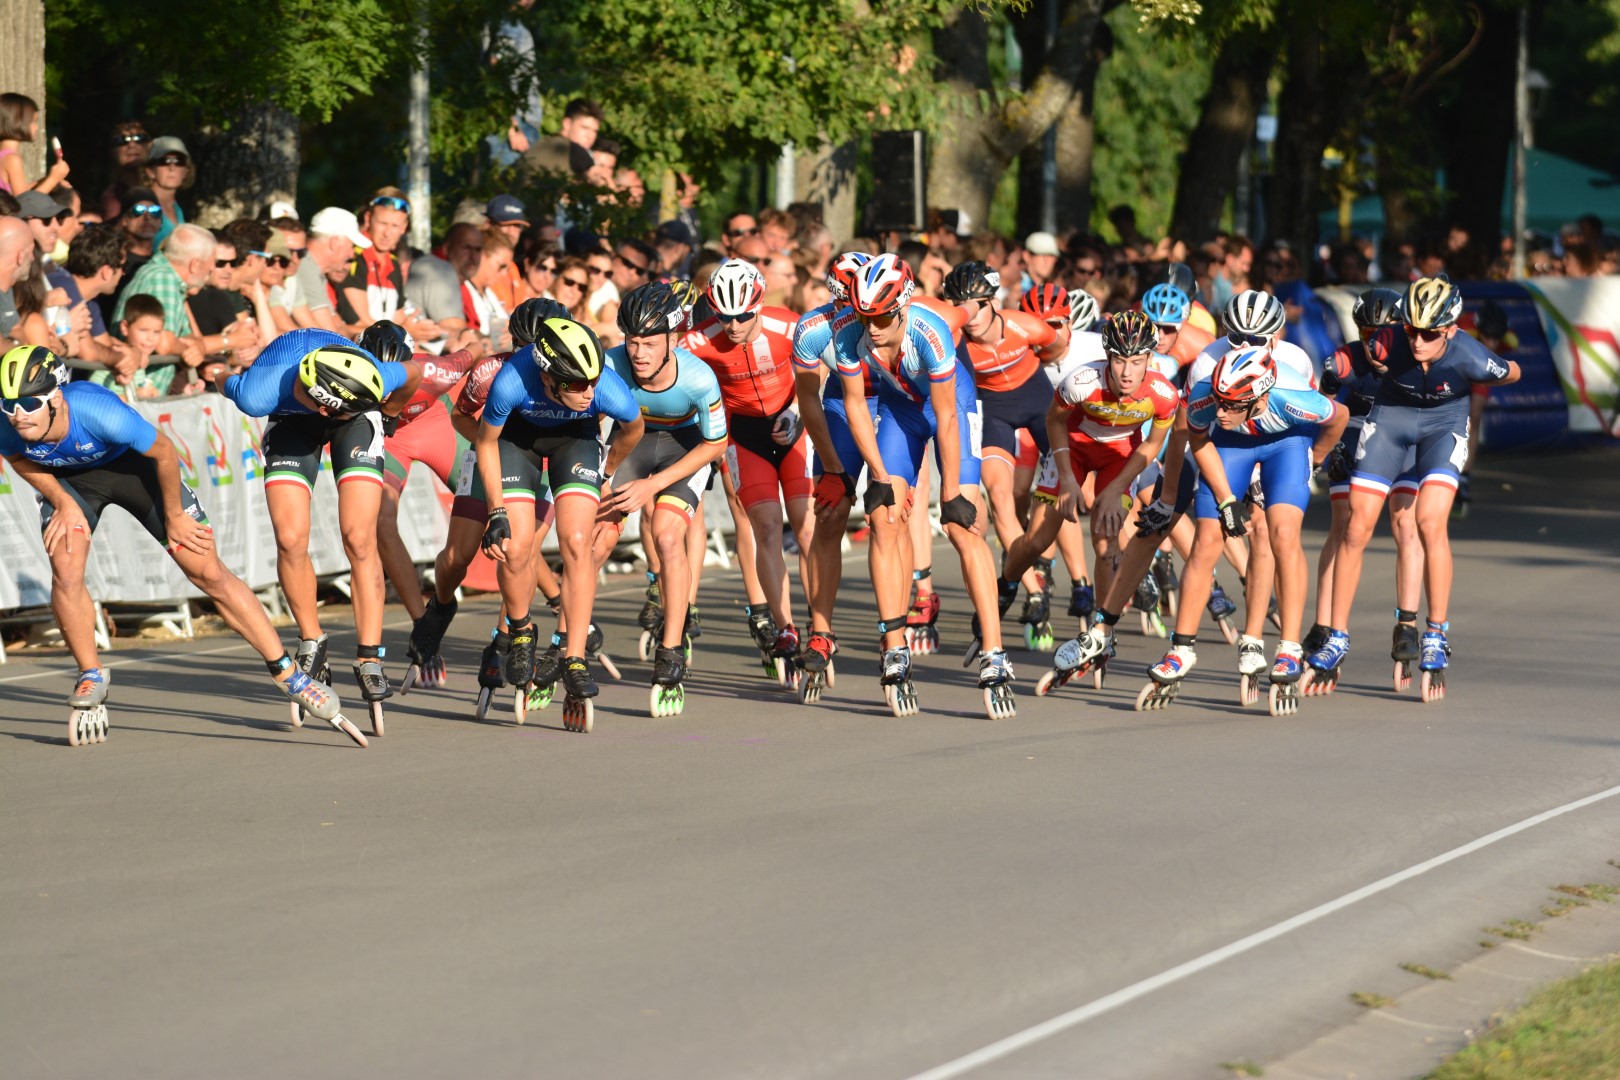
Race flow graphs
Analyze and compare every overtake that happened during races
Explore the tool that will visulize all movements within a races. See winning strategies of the best skaters in history.
Head over to the Edit section to start analyzing races on the timeline yourself.
- X axis: represents the passed laps during the race
- Y axis: represents the skaters current position


